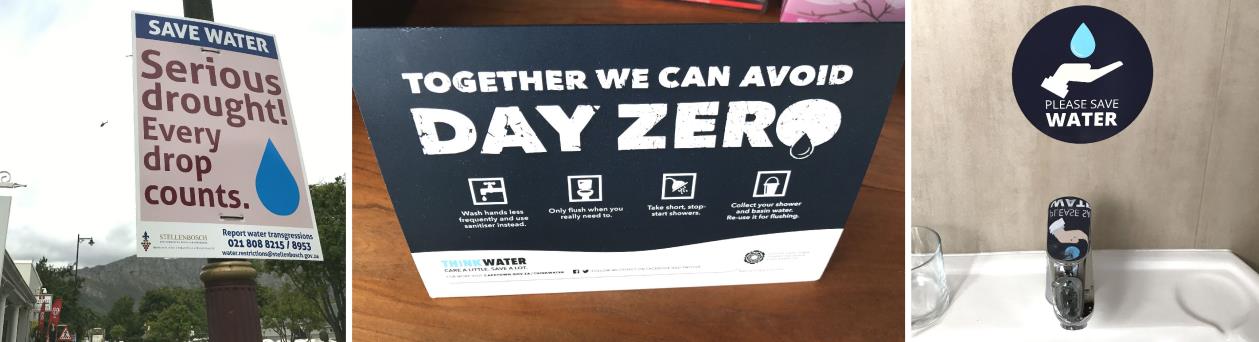
After the arrival at Cape Town International Airport, it takes visitors just a few minutes these days to realize how serious the drought of the last three years must have affected the area. Empty taps in the lavatory, hand sanitizer instead of liquid soap and the omnipresent campaign on how to save water.
Three consecutive years of low precipitation has contributed to unprecedented water shortages in the Western Cape and Capetonians are now coping with one of the worst droughts ever recorded. Residents are currently being asked to consume just 50 litres per day, and could be limited to a mere 25 litres, should “Day Zero” arrive (see http://coct.co/water-dashboard). The socio-economic impacts are already significant and predicted to weigh heavily on South Africa’s growth outlook (HSBC Global Research).
The Western Cape shows the highest variability of mean annual precipitation of all South Africa’s provinces (Schulze 1997). Cape Town receives about 850mm of average rainfall per year, while the nearby Jonkershoek valley averages at 1390mm and its Dwarsberg station even records 3620mm of rain a year (Moses 2008). It is mainly the orographic precipitation, when humid air masses from the Atlantic Ocean are forced upwards at mountain barriers that feeds the reservoirs and Cape Town’s water supply.
GlobeDrought, a research project co-funded through the Global Resource Water (GRoW) funding measure and part of the „Research for Sustainable Development (FONA)“ framework of the German Federal Ministry of Education and Research (BMBF), aims to develop a web-based information system that comprehensively characterises drought events (www.grow-globedrought.net). The project will produce a spatially explicit description of drought risks by considering three components: drought hazard, exposure and vulnerability. The global-scale analyses planned for the project will be supplemented by detailed analyses for regions heavily affected by droughts such as Southern Africa.
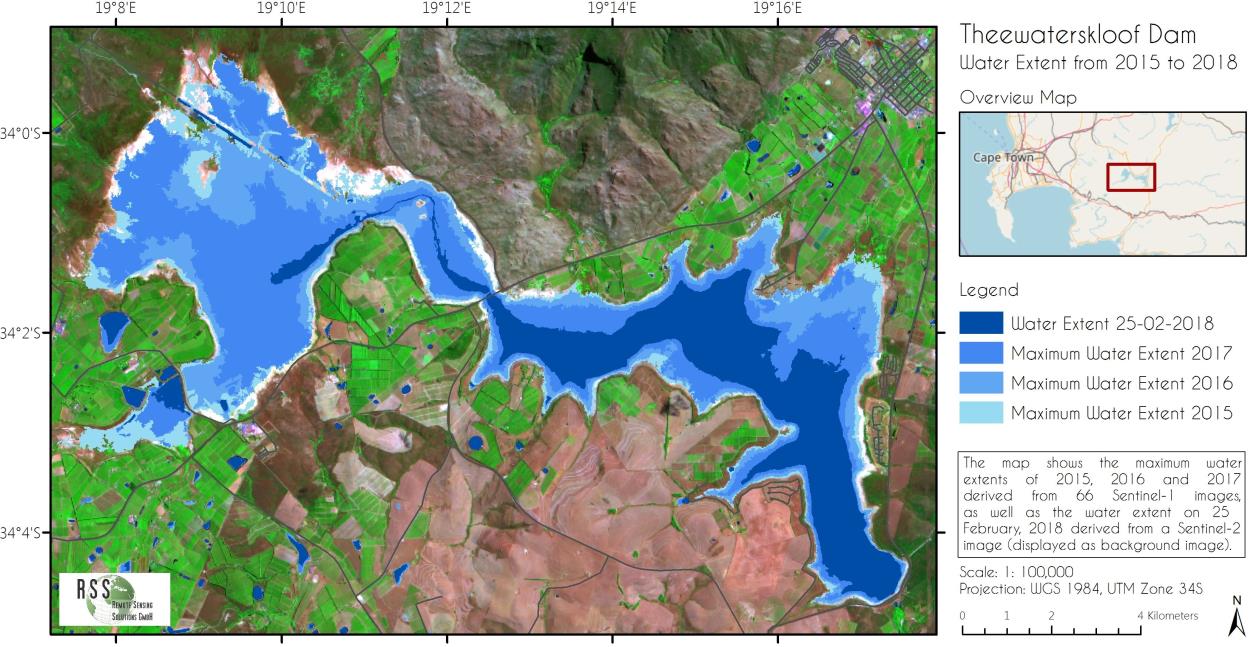
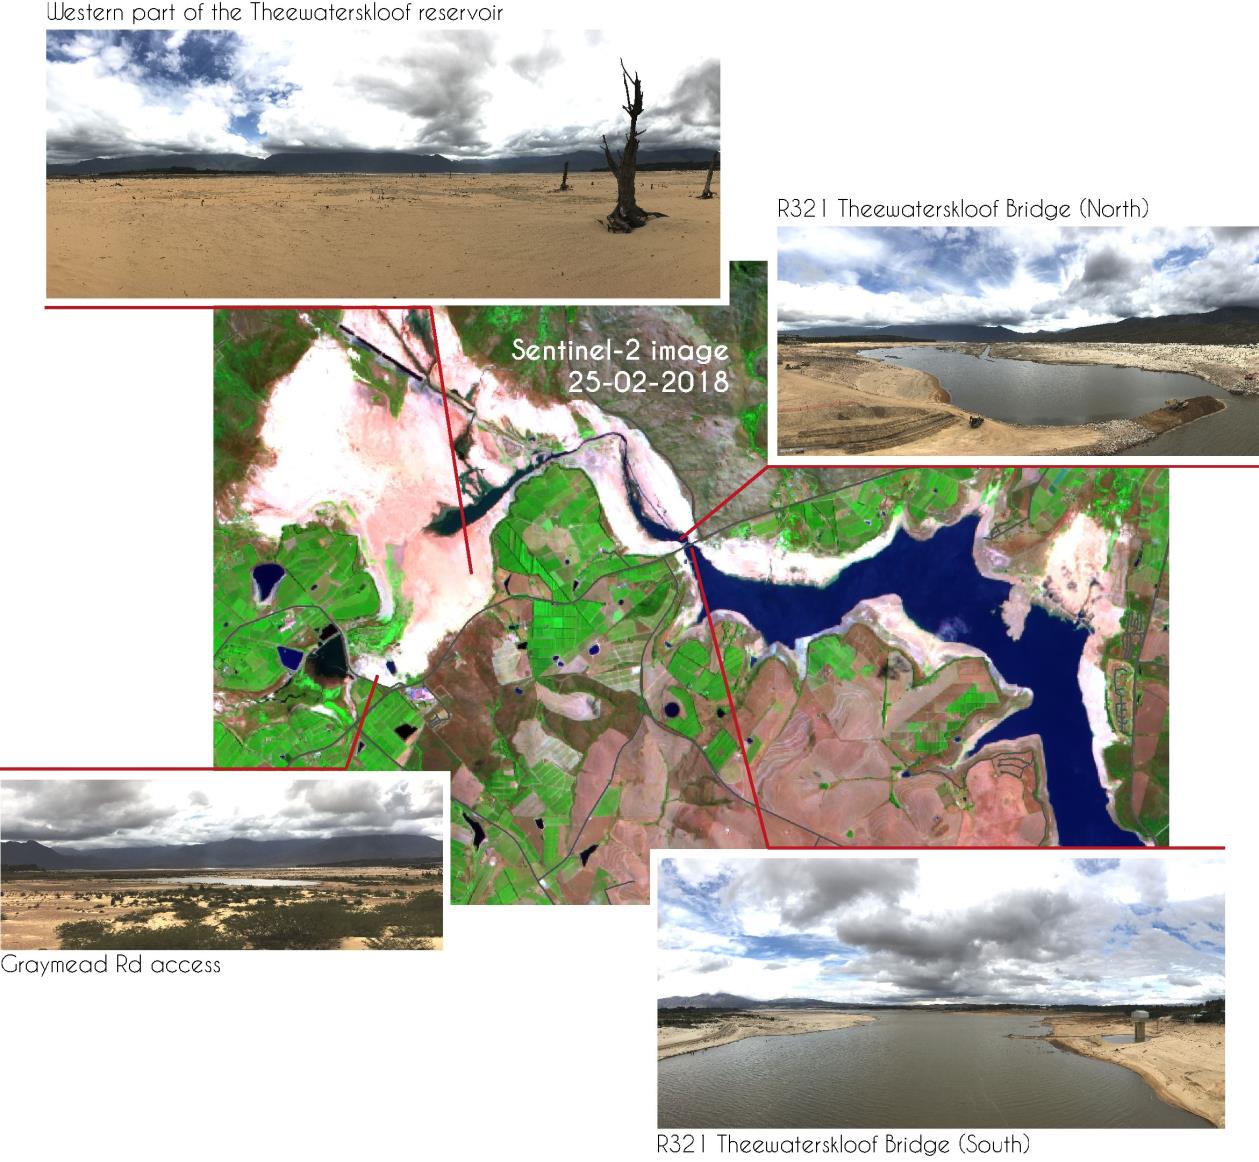
Remote Sensing Solutions GmbH (www.rssgmbh.de), one of the GlobeDrought consortium members, used Sentinel-1 satellite data from the European Copernicus Programme to monitor the decreasing water extent in the main dams that supply water for Cape Town. In total, 66 Sentinel-1 radar images acquired since March 2015, were used to track monthly changes in surface water occurrence, frequency and dynamics. The map below shows the maximum water extents of the Theewaterskloof Dam in 2015, 2016 and 2017 as well as the dam’s water extent on February 25, 2018. A team from RSS GmbH also acquired field data in the area on March 06, 2018. At this date, the remaining capacity of the dam was at 10.9 % of its full capacity (Department of Water and Sanitation). The second figure relays the true situation on the ground by comparing the latest Sentinel-2 image from 25-02-2018 with photos taken 10 days later. Linking such satellite derived water occurrence information with gauge data, rainfall data and water consumption rates, helps to identify and predict critical situations in water supply at an early stage.
At the beginning of March, 2018, Western Cape officials declared that “Day Zero” would be avoided this year. However, the water levels of the reservoirs are highly dependent on winter rainfall and it will probably take 3-4 consecutive years of substantial winter rainfall to return to normal water levels. This means that the situation may remain critical in the near future. The City of Cape Town is currently investigating alternative water resources such as the potential use of groundwater, desalination and grey-water. In the context of climate change, local authorities need developing long-term strategies for adaptation and resilience as soon as possible (Chan et al. 2018).
References:
- Chan, W.-S., Faulkner, D., Ridley, M., Joseph, A. & Mosadi, T. (2018): Running dry in Cape Town. HSBC Global Research. Climate Change & Economics Global.
Day Zero Dashboard: http://coct.co/water-dashboard/ - Department of Water and Sanitation & City of Cape Town. Dam levels: http://www.capetown.gov.za/Family%20and%20home/residential-utility-services/residential-water-and-sanitation-services/this-weeks-dam-levels
- Moses, G. (2008): The establishment of the long-term rainfall trends in the annual rainfall patterns in the Jonkershoek valles, Western Cape, South Africa. Department of Earth Sciences, University of the Western Cape. 94pp.
- Schulze, R.E. (1997): South African Atlas of Agrohydrology and Climatology. Water Research Commission Report No. TT82/96, ACRU Report 46, 1997.
Text & Photos: Jonas Franke & Natalie Cornish (Remote Sensing Solutions GmbH)